Initiating coverage | Luggage
November 19, 2018
VIP Industries
BUY
CMP
`462
Secular play on consumption and changing lifestyle.
Target Price
`555
VIP Industries Ltd (VIP) is the largest luggage player in India with ~50%+
Investment Period
12 Months
market share in the organised market. It has been able to create successful
sub brands like Carlton, VIP Bags, Skybags, Aristocrat, Alfa and Caprese. We
Stock Info
feel that the company is in very sweet spot where it is gaining market share
from unorganised players and can grow at 25%+ CAGR for next couple of
Sector
Luggages
years.
Market Cap (` cr)
6,514
Favourable Industry dynamics for organized players post GST: Indian luggage
Gross Debt (` cr)
Nil
industry is valued at `10000cr+ and is largely dominated by the unorganized
Beta
1.3
players. The top three branded players - VIP, Samsonite and Safari forms
52 Week High / Low
645/287
~30% of this market. Owing to improving economy and increasing travel, the
luggage industry has posted a 13%+ CAGR in the past few years and is
Avg. Daily Volume
24,099
expected to maintain this momentum for next few years. With GST
Face Value (`)
2
implementation in 2017, the new cost dynamics has further led to industry
BSE Sensex
35,457
shifting towards organized players.
Nifty
10,682
Diversified product portfolio and strong sub brands: VIP’s has one of the most
Reuters Code
VIPI.BO
diversified luggage offerings. The company’s sub brand like Aristocrat and
Alfa cater to the mass segments while the brands like Carlton, Caprese and
Bloomberg Code
VIP@IN
V.I.P. cater to the mid to premium segment. The company is also targeting the
youth through its trendy brand - Skybags which is one of the fastest growing
category.
Shareholding Pattern (%)
Strong brand visibility with wide distribution network: VIP has been able to
Promoters
53.5
create strong sub brands by continuously spending ~5-6% percentage of
MF / Banks / Indian Fls
28.1
annual revenue on advertising. It has also started using film star celebrities as
FII / NRIs / OCBs
12.1
brand ambassador for creation of strong individual sub brands. Currently, VIP
Indian Public / Others
13.2
has distribution network of over 10,000+ retail outlets points of sale which
has increased from ~8000 points in ~two years.
Outlook and Valuation: Backed by robust growth in volume and better brand
Abs. (%)
3m
1yr
3yr
awareness, we expect VIP to report a CAGR of ~26% and 35% respectively in
Sensex
(6.7)
1.4
38.1
top line and bottom-line respectively over FY2018-20E. The recent correction
has given the investors an opportunity to invest in a market leader with
VIP
(20.6)
49.4
394.0
favourable demand dynamics. It is currently trading at a P/E of 29x its FY2020E
EPS which looks attractive looking at its leadership position in a growing sector.
Hence we initiate coverage on the stock with a Buy recommendation and target
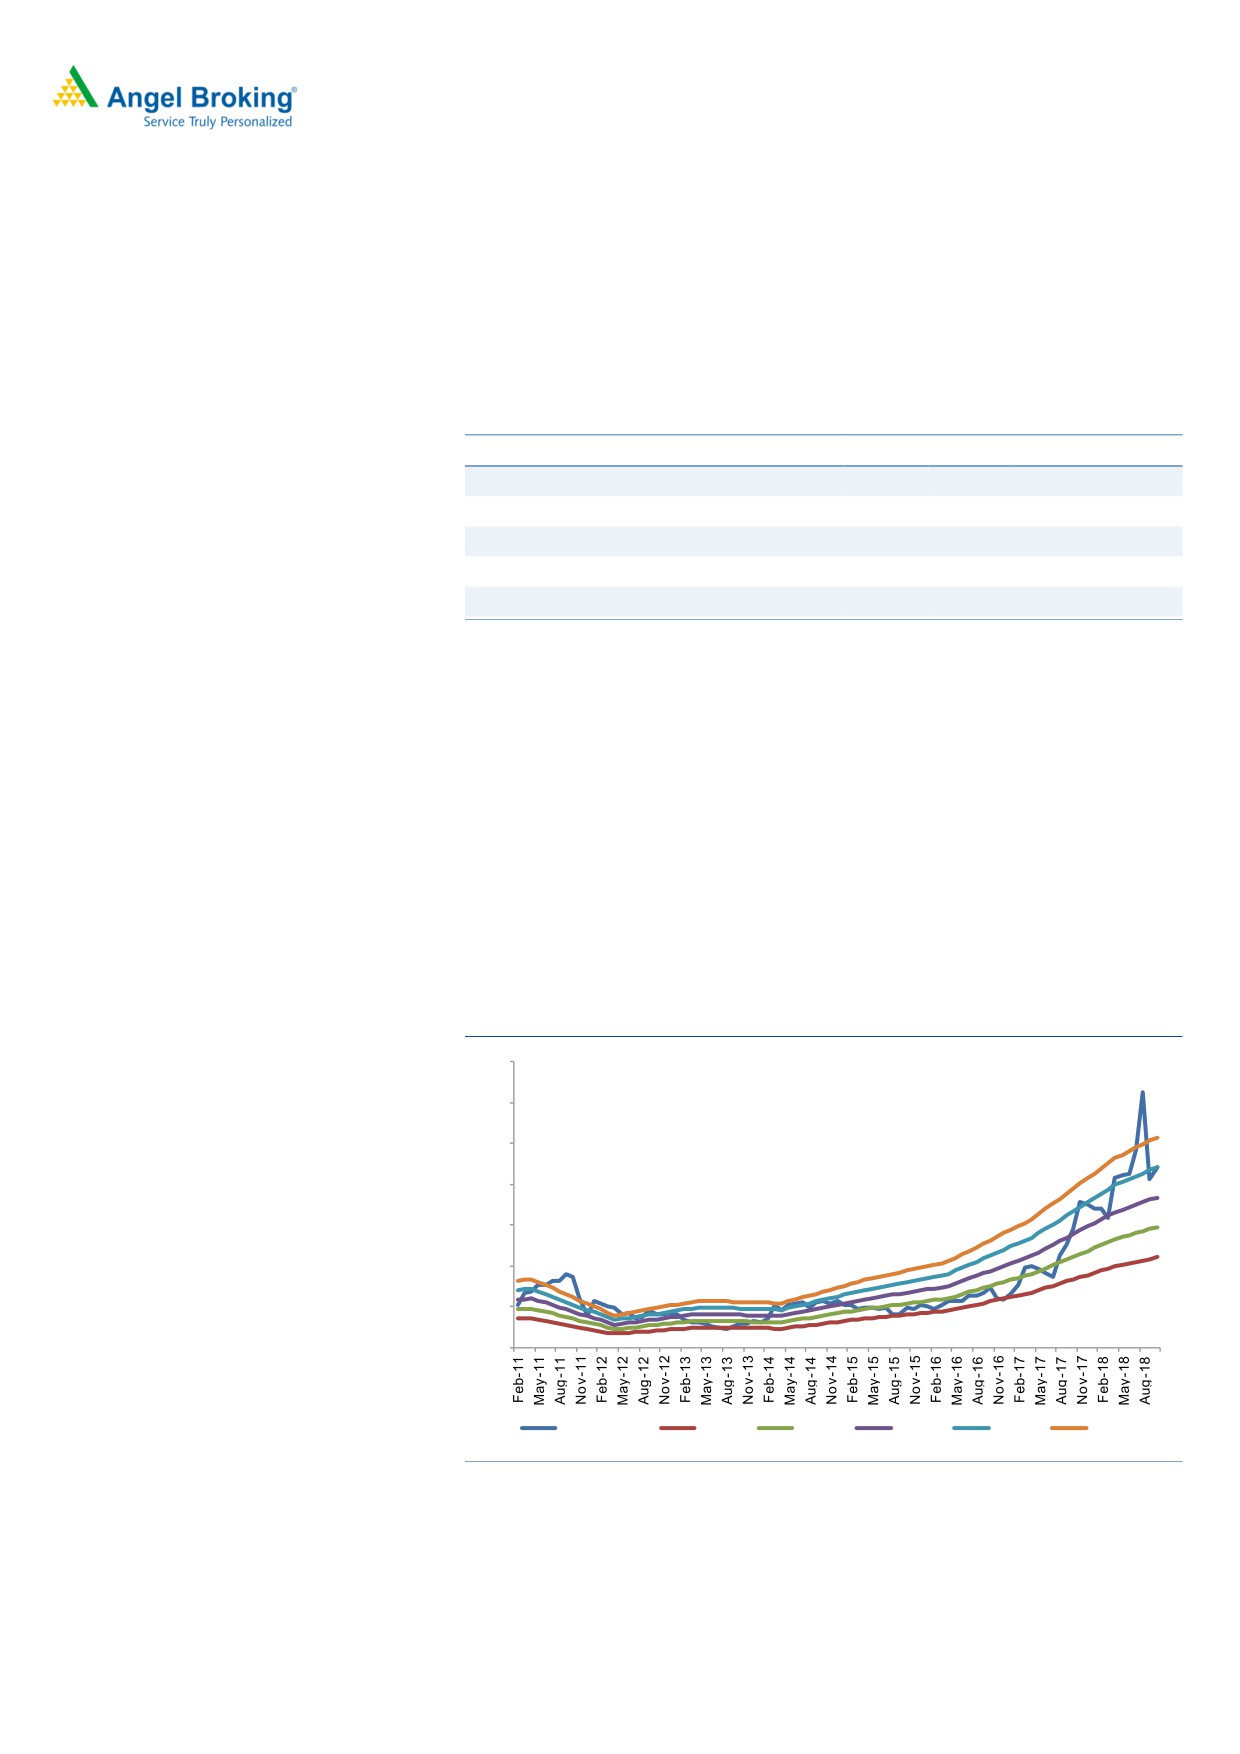
3 year daily price chart
price of `555 (35x FY2020E EPS), indicating an upside of ~20% from the current
levels.
Key financials
Y/E March (` cr)
FY2016
FY2017
FY2018
FY2019E
FY2020E
Net Sales
1,216
1,252
1,410
1,804
2,255
% chg
16.1
2.9
12.6
28.0
25.0
Net Profit
66
85
127
179
225
% chg
52.7
28.2
48.8
41.3
25.5
OPM (%)
8.9
10.6
13.7
15.0
15.0
EPS (Rs)
4.7
6.0
9.0
12.7
15.9
Source: Company, Angel Research
P/E (x)
98.2
76.8
51.5
36.5
29.0
P/BV (x)
19.2
16.0
13.3
11.6
9.4
RoE (%)
19.6
20.9
25.9
31.7
32.4
Nidhi Agrawal
RoCE (%)
26.6
29.1
36.9
45.4
46.6
022-39357800 Ext: 6872
EV/Sales (x)
5.4
5.2
4.6
3.6
2.9
EV/EBITDA (x)
60.4
48.7
33.3
23.9
19.1
Source: Company, Angel Research, Note: CMP as of November 19, 2018
Please refer to important disclosures at the end of this report
1
Initiating Coverage
VIP Industries
Investment Arguments
Growth to be driven by shift in trend from unorganized to organized sector
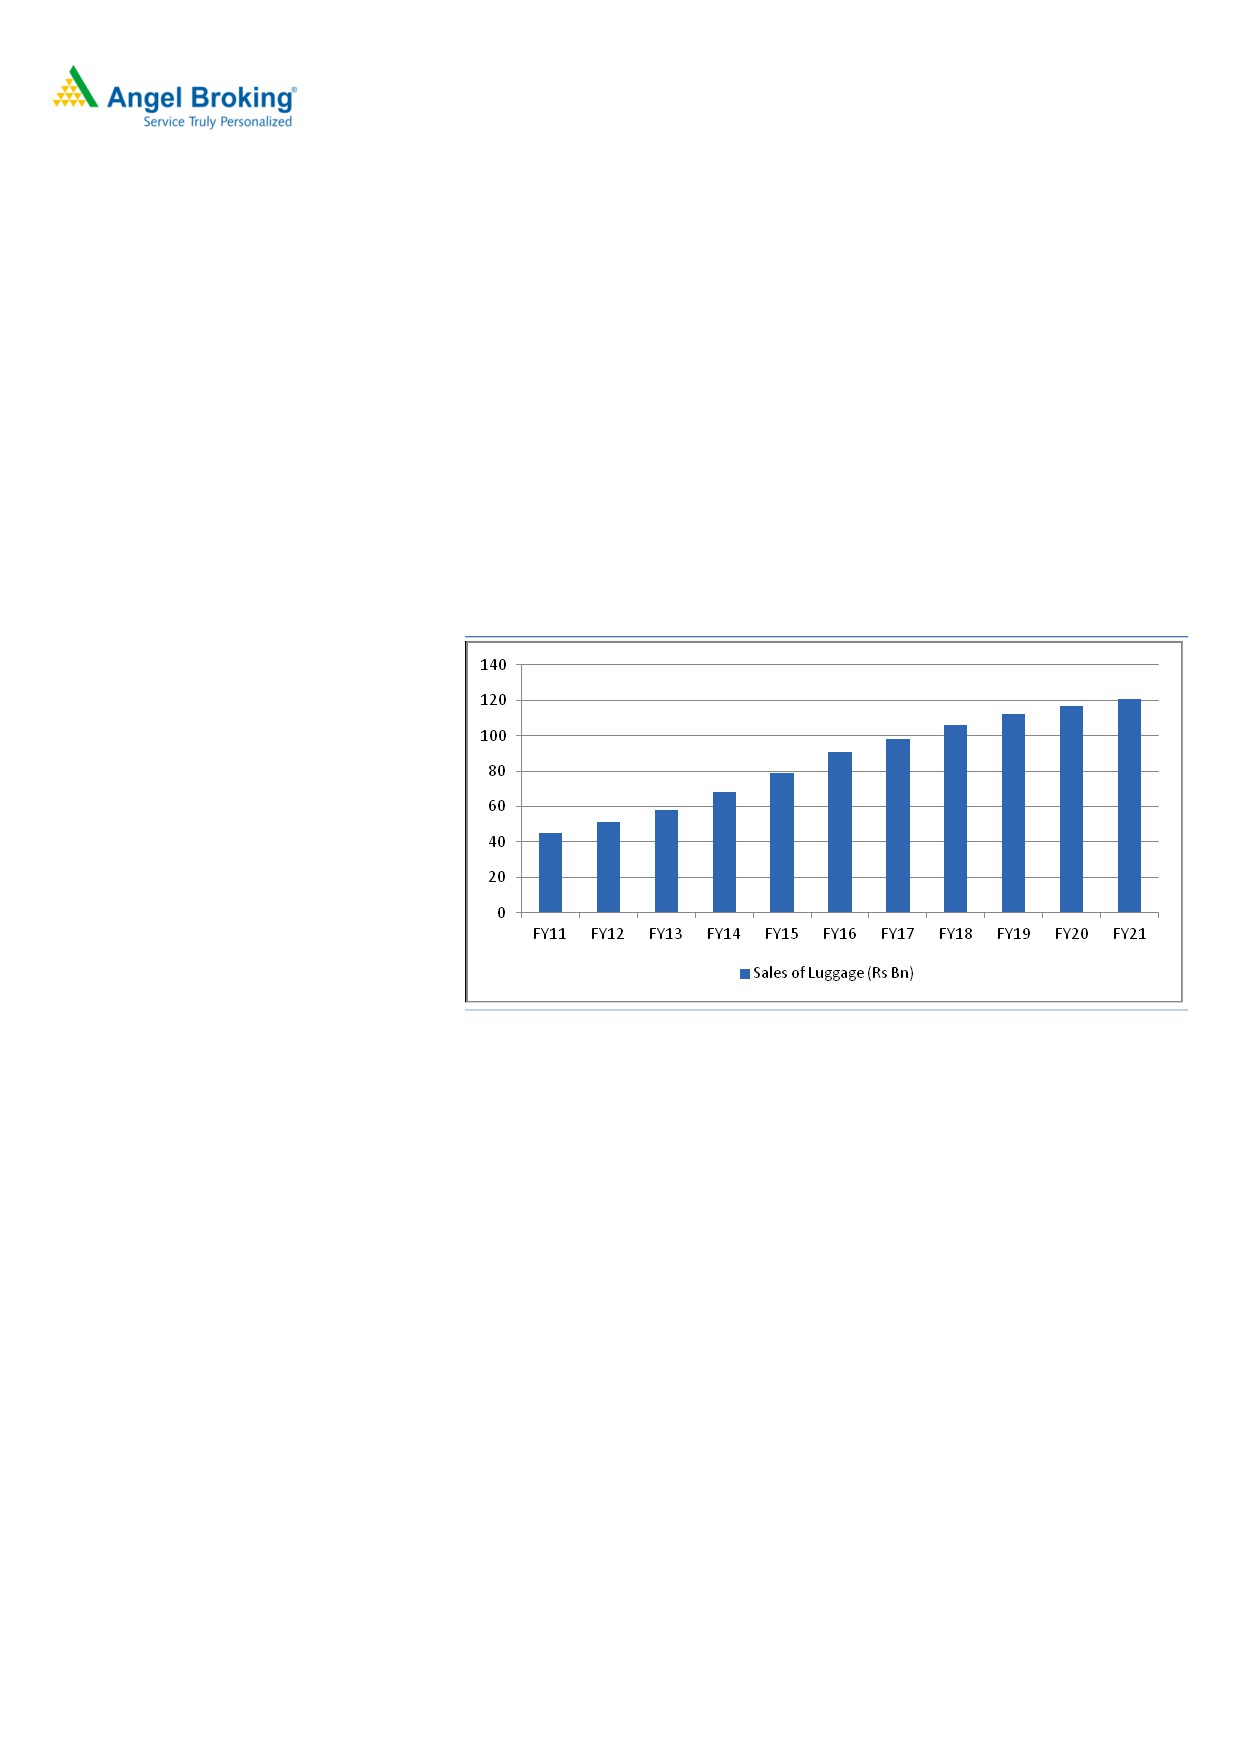
The Indian luggage industry is valued at `10000cr+ and is largely dominated by
the unorganized sector. The top three branded players namely- VIP Industries,
Samsonite and Safari forms only ~30% of this market. VIP Industries is the market
leader with over 50% market share whereas Samsonite has been losing market
share ( current at ~35% from the past level of 50%). Owing to improving
economy, consumer confidence and increasing travel, the luggage industry has
posted a 13%+ CAGR in the past few years and is expected to maintain this
momentum for the next few years.
Exhibit 1: Luggage industry posted ~15% CAGR during 2011-16
Source: Safari Industries PPT, Angel research
GST has created a level playing field for organized players
With the implementation of the GST in 2017, the indirect tax is to be paid by the
unorganised players as well @18% versus earlier 0-12% level. This has reduce the
pricing gap between the organized and unorganized players has reduced, thereby
providing a level playing field to the organized players. Now the customer is
giving preference to the branded players over the non branded ones for the
marginal price difference. This has boosted the sales of all the three major
players in the last 1 year.
November 19, 2018
2
Initiating Coverage
VIP Industries
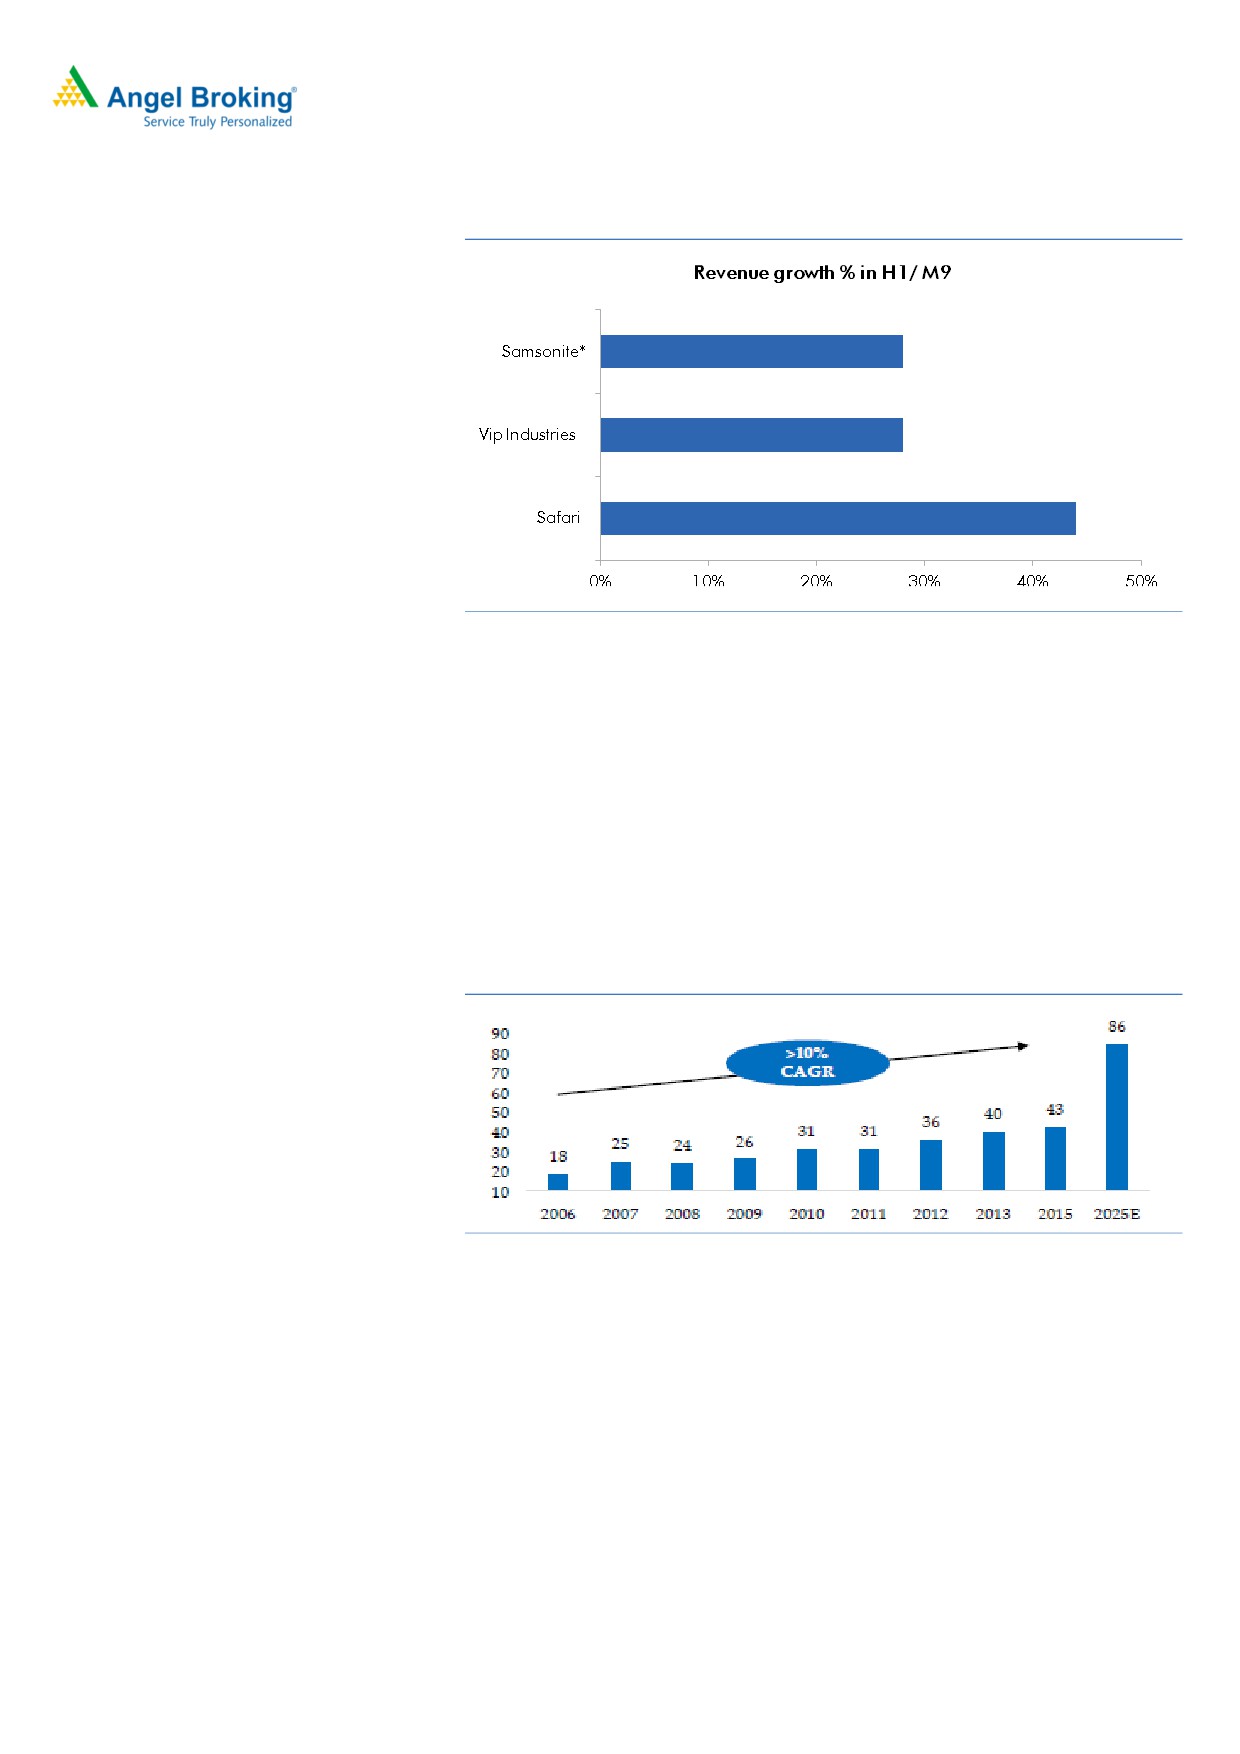
Exhibit 2: Revenue has picked up for the top 3 players
Source: Companies, Angel Research* Samsonite revenue for M9FY18
Increasing travel and premiumization is driving the growth
Most players are coming up with more youth-orientated products like lightweight
and more efficient backpacks and duffel bags. Robust demand for luggage is led
by the fact that most youngsters now are keen on travel and adventure, increasing
demand for hands-free and hassle-free luggage. The Indian luggage industry is
likely to benefit as the people have become more demanding in term of style and
comfort for travel luggage. VIP with its mid to premium offerings is likely to see
better margins as compared to Safari which mainly offers in the economy
segments.
Exhibit 3: Indian tourism industry growing >10% CAGR
Source: Safari Industries PPT, Angel research
Diversified product portfolio and catering to all segment of customers
VIP’s has one of the most diversified luggage offerings, which caters to consumers
of all income groups. The company’s brand like Aristocrat and Alfa cater to the
mass segments while the brands like Carlton, Caprese and V.I.P. cater to the mid
to premium segment. The company is also targeting the youth through its trendy
brand - Skybags which is one of the fastest growing category.
November 19, 2018
3
Initiating Coverage
VIP Industries
Exhibit 4: Launch of new brands
Brand
Year
Brand Positioning
VIP
1971
Mass mid-premium
Alfa
1971
Mass market targeted to convert consumers purchasing unbranded luggage to VIPs products
Carlton
2004
Premium international brand, targeted towards young professionals
Aristocrat
2007
Value for money
Skybags
2012
Youth oriented, stylish
Caprese
2012
Mass-premium, targeted towards fashion conscious urban women
Source: Company, Angel Research
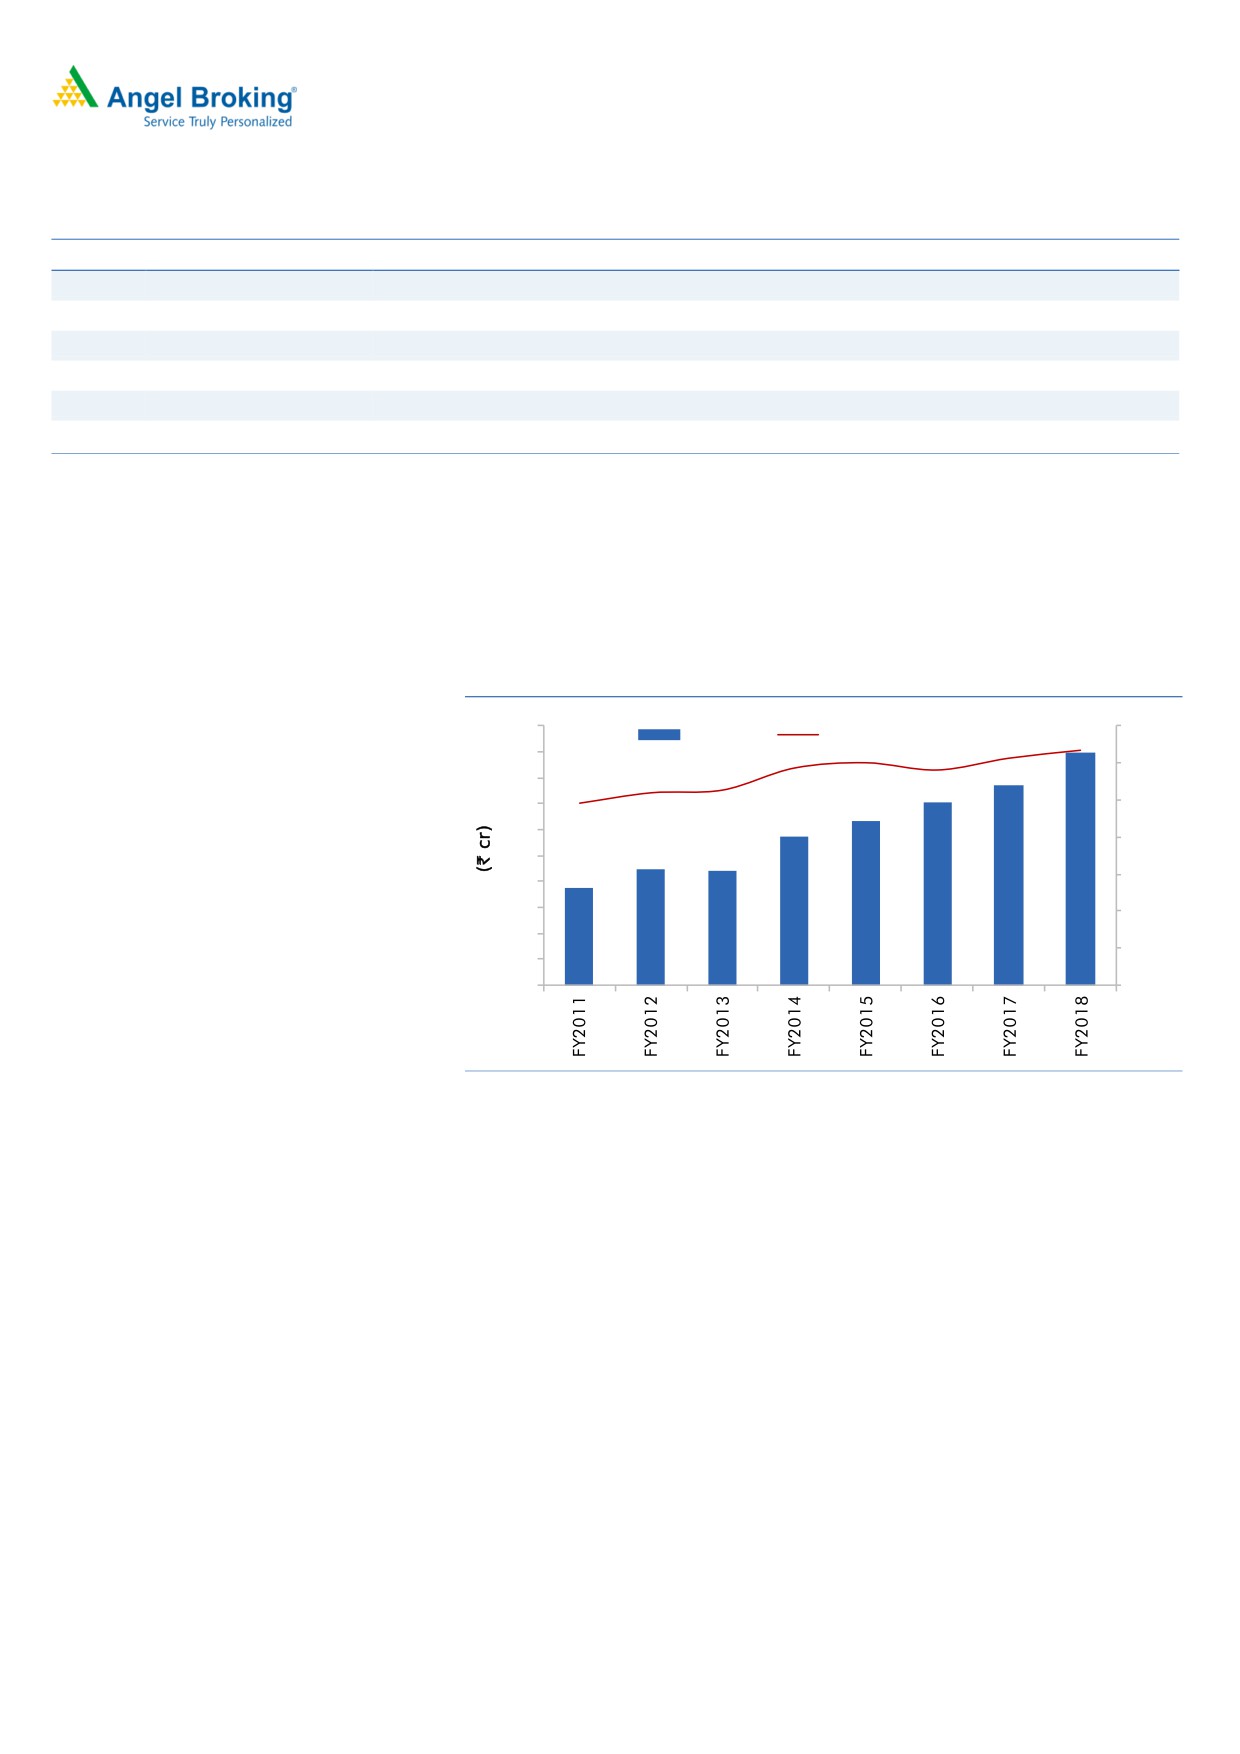
Multiple sub brands led by aggressive advertising
Historically, the company is continuously spending amount around
5-6%
(percentage of sales) on ad spend to increase their brand visibility. Recently, the
company has started celebrity endorsement which will further boost its brand
visibility.
Exhibit 5: Ad spend % of net sales
100
7.0%
Ad spend
% of sales
90
6.0%
80
70
5.0%
60
4.0%
50
3.0%
40
30
2.0%
20
1.0%
10
0
0.0%
Source: Company, Angel Research
Wide distribution network
Currently, VIP has distribution network of over 10,000+ retail outlets points of sale
which has increased from ~8000 points two years back. Channel wise, Canteen
Stores Department (CSD) share has fallen post implementation of GST. Online
sales forms 5-6% of its sales and may increase now as the company is focusing on
this segment.
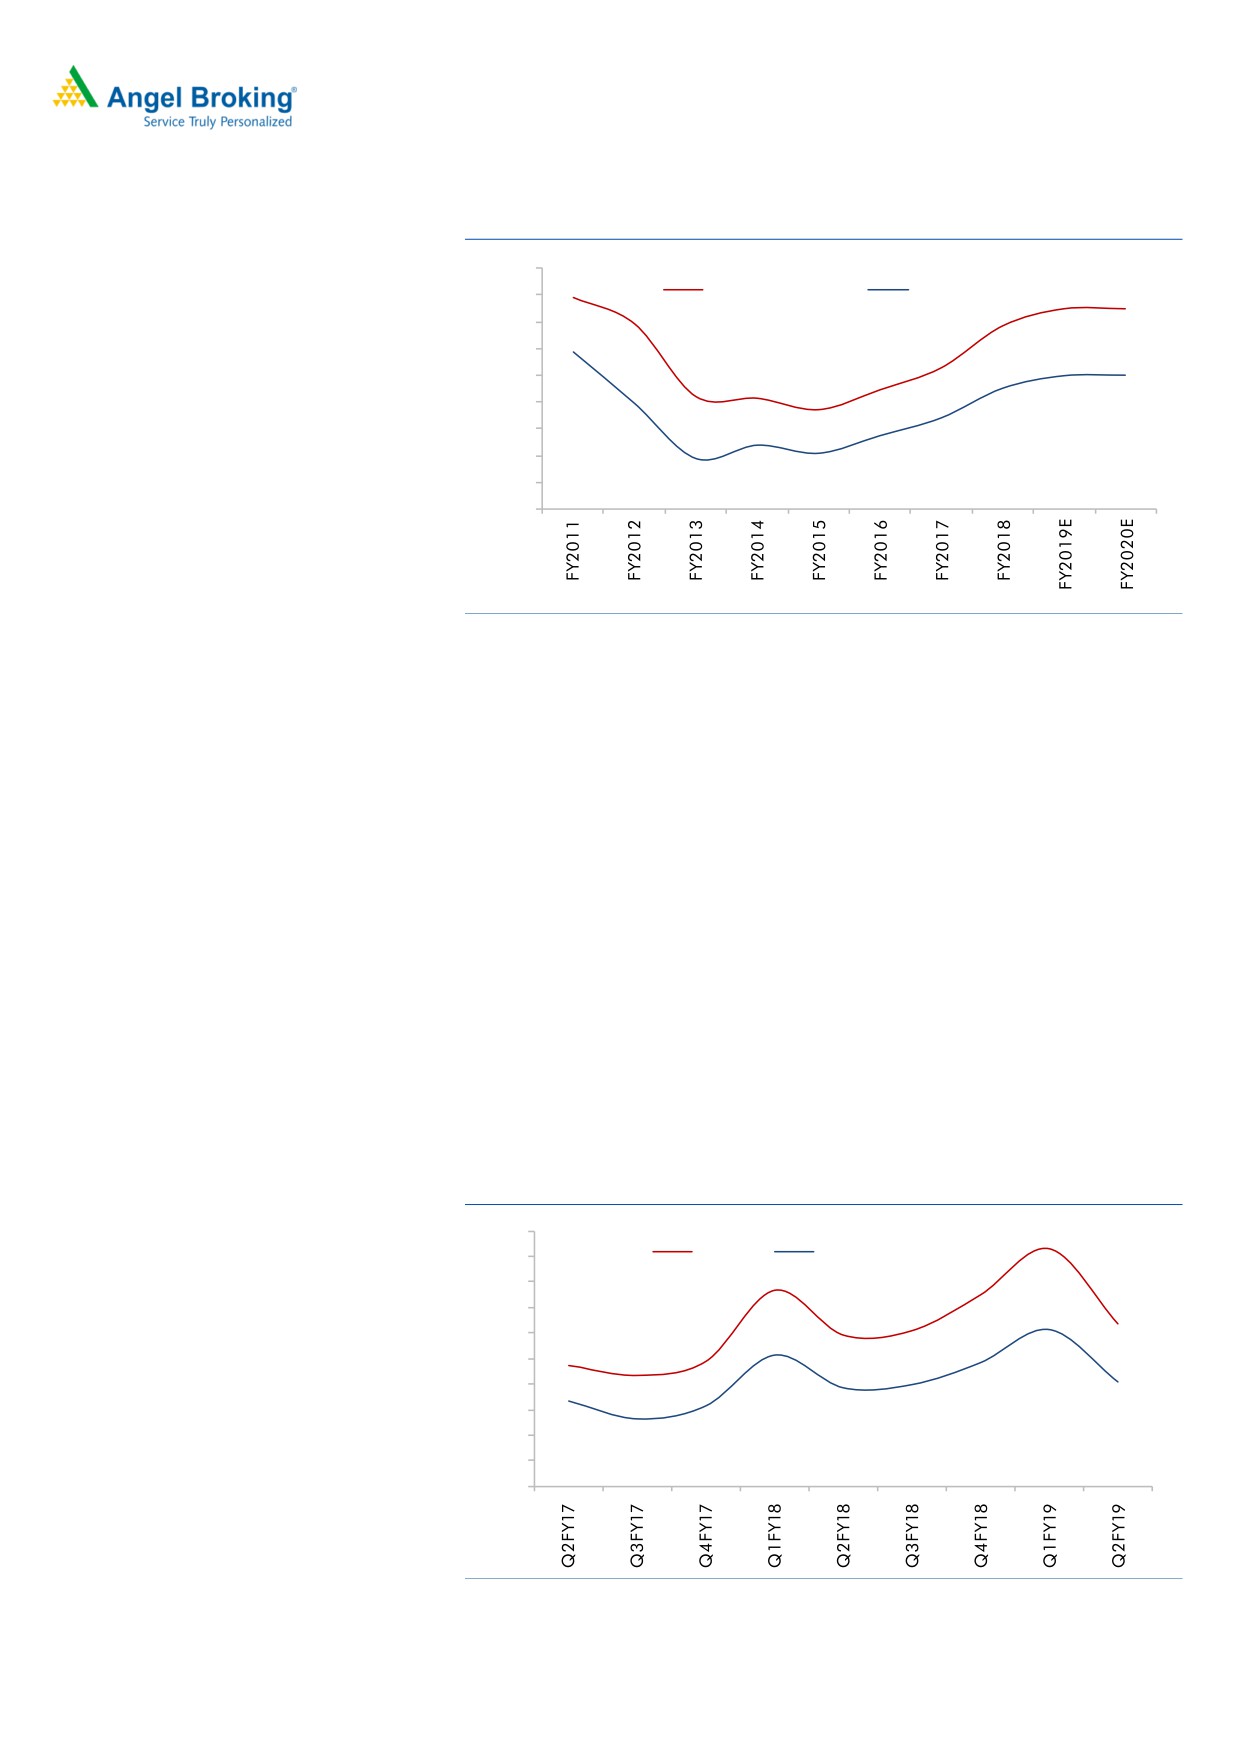
Margins expand substantially in FY2018
The company has almost doubled its margins over FY2015-18 driven by product
premiumization, better negotiation with Chinese suppliers and relatively stable INR
exchange rate. 76% of its revenue comes from soft luggage, which is largely
imported from China. It has dedicated team of designers in various part of globe
like China, Hong Kong which gives designs to the Chinese manufacturer. Soft
luggage manufacturing involves labour as the key cost component. Hence, it has
recently started sourcing soft luggage from Bangladesh which has relatively lower
labour cost over India and China.
November 19, 2018
4
Initiating Coverage
VIP Industries
Exhibit 6: Margins are on uptrend from historical levels
18.0%
EBITDA margin %
PAT margin %
16.0%
14.0%
12.0%
10.0%
8.0%
6.0%
4.0%
2.0%
0.0%
Source: Company, Angel Research
Q2FY2019 showed margin pressure, still margins would be higher than historical
level
The company reported a peak margin of 18.6% in Q1FY2019 ( Q1 is a usually
the strongest quarter of the year with the strongest margins) from which it has
cooled off in Q2FY2019 at 12.7%. Further, the rupee depreciation and rise in
import duty on luggage in Q2FY2019 have led to this contraction in margin on
sequential basis. On the yearly basis, margins have still expanded by 88 bps on a
strong revenue growth. The company has also indicated that the margin pressure
may continue for some time as the intense competition is making the price hike
difficult specially at the lower priced products. We feel that the company may still
be reporting stable margins at 14-15% level for the next few years (on secular
demand outlook and its multiple strong sub brands) which is above its historical
margin level of 10-11%. Sourcing from Bangladesh also helps in mitigating import
duty impact as it does not attract import duty and ha slower labour cost. It plans to
procure upto 20% of the total revenue from Bangladesh.
Exhibit 7: Margins peaked at Q1FY2019
20.0%
18.0%
OPM %
PAT Margin %
16.0%
14.0%
12.0%
10.0%
8.0%
6.0%
4.0%
2.0%
0.0%
Source: Company, Angel Research
November 19, 2018
5
Initiating Coverage
VIP Industries
Efficient working capital management and debt free balance sheet
Driven by its efficient working capital management, low capex requirement and
robust operating cash flow generation, the company is debt free. It also has robust
return ratios.
Exhibit 8: Turnover ratios
(x)
FY2016 FY2017 FY2018 FY2019E FY2020E
Asset Turnover (Gross Block)
4.4
4.4
4.5
5.1
5.7
Inventory / Sales (days)
86
87
87
87
87
Receivables (days)
45
35
46
46
46
Payables (days)
52
42
55
55
55
Working capital cycle (ex-cash) (days)
79
80
78
78
78
Source: Company, Angel Research
Outlook and Valuation
Backed by robust growth in volume and better brand awareness, we expect VIP to
report a CAGR of ~26% and 35% respectively in top line and bottom-line
respectively over FY2018-20E. The recent correction has given the investors an
opportunity to invest in a market leader with favourable demand dynamics. It is
currently trading at a P/E of 29x its FY2020E EPS which looks attractive looking at
its leadership position in a growing sector. Hence we initiate coverage on the stock
with a Buy recommendation and target price of `555 (35x FY2020E EPS),
indicating an upside of ~20% from the current levels.
Exhibit 9: One year forward PE chart
700
600
500
400
300
200
100
0
Closing price
15.0 X
20.0 X
25.0 X
30.0 X
35.0 X
Source: Company, Angel Research
November 19, 2018
6
Initiating Coverage
VIP Industries
Exhibit 10: Comparison with Safari Industries
Revenue(`cr)
OPM %
PAT (`cr)
FY18
FY19
FY20
CAGR %
FY18
FY19
FY20
FY18
FY19
FY20
VIP industries
1410
1804
2255
26.5%
13.7
15.0
15.0
126.8
179.0
224.7
Safari Industries
415
540
702
30.0%
9.8
12.9
12.9
21
41
55
EPS(`)
P/E(x)
ROE%
FY18
FY19
FY20
CAGR %
FY18
FY19
FY20
FY18
FY19
FY20
VIP industries
9
13
16
33.2%
51.5
36.5
29.0
25.9
31.7
32.4
Safari Industries
10
18
25
60.4%
78.5
40.8
30.5
12.3
12.3
12.3
Source: Company, Angel Research
The downside risks to our estimates include
1) Increase in competition from unorganized as well organized players would
impact overall growth of the company. Recently, Xiomi, the aggressive Chinese
player has entered this segment via the online channel.
2) VIP’s 24% sales comes from hard luggage segment and any increase in input
cost (most of the key raw material is polypropylene and aluminum) could
negatively impact profitability if the price hike doesn’t take place
3) Volatility in foreign currency fluctuation could impact the company’s profitability
(70% of VIP’s revenue comes soft luggage segment which is largely imported from
China). Recently the company has started procuring from Bangladesh to mitigate
this risk. Bangladesh has the lower labour cost and doesn’t attract import duty.
November 19, 2018
7
Initiating Coverage
VIP Industries
Company Background
VIP Industries Ltd (VIP) operates in Luggage, Bags & Accessories, and Furniture
segments. The Company has a range of brands across luggage categories. The
Company's brands include Carlton, VIP Bags, Skybags, Aristocrat, Alfa and
Caprese. The Company's product range includes trolleys, rucksacks, backpacks,
duffel bags, laptop bags, travel accessories, short haul essentials, soft uprights,
vanity cases, hard suitcases, briefcases and uprights, among others. It has
approximately 10000 retail outlets across India and with a network of over 1300
retailers across approximately 30 countries. The Company's subsidiaries include
VIP Industries Bangladesh Private Limited and Blow Plast Retail Limited. VIP
Industries Bangladesh Private Limited manufactures and markets luggage and
bags.
Exhibit 11: Revenue break-up for VIP (FY2018)
24%
76%
Soft Luggage
Hard Luggage
Source: Company, Angel Research
November 19, 2018
8
Initiating Coverage
VIP Industries
Income statement
Y/E March (`cr)
FY2016
FY2017
FY2018
FY2019E
FY2020E
Total operating income
1,216
1,252
1,410
1,804
2,255
% chg
16.1
2.9
12.6
28.0
25.0
Total Expenditure
1,108
1,119
1,216
1,533
1,916
Raw Material
663
676
712
911
1,138
Personnel
126
140
159
189
237
Others Expenses
320
304
345
433
541
EBITDA
108
132
193
271
338
% chg
39.6
22.3
46.1
40.0
25.0
(% of Net Sales)
8.9
10.6
13.7
15.0
15.0
Depreciation
14
14
13
14
16
EBIT
94
119
181
257
323
% chg
56.8
26.3
52.0
42.1
25.7
(% of Net Sales)
7.7
9.5
12.8
14.2
14.3
Interest & other Charges
1
1
0
1
1
Other Income
2
8
9
11
13
(% of PBT)
2.4
6.0
4.9
4.2
4.0
Share in profit of Associates
-
-
-
-
Recurring PBT
95
126
190
267
335
% chg
45.2
32.1
50.9
41.0
25.5
Tax
29
40
63
88
111
(% of PBT)
30.1
32.2
33.1
33.0
33.0
PAT (reported)
66
85
127
179
225
Extraordinary Items
-
-
-
-
-
ADJ. PAT
66
85
127
179
225
% chg
52.7
28.2
48.8
41.3
25.5
(% of Net Sales)
5.5
6.8
9.0
9.9
10.0
Basic EPS (Rs)
4.7
6.0
9.0
12.7
15.9
Fully Diluted EPS (Rs)
4.7
6.0
9.0
12.7
15.9
% chg
52.7
27.9
49.2
41.3
25.5
Source: Company, Angel Research
November 19, 2018
9
Initiating Coverage
VIP Industries
Balance Sheet
Y/E March (` cr)
FY2016
FY2017
FY2018
FY2019E
FY2020E
SOURCES OF FUNDS
Equity Share Capital
28
28
28
28
28
Reserves& Surplus
311
380
461
536
665
Shareholders’ Funds
339
408
489
565
693
Minority Interest
-
-
-
-
-
Total Loans
14
-
-
-
-
Provisions and other
9
10
10
10
NC liabilities
Deferred Tax Liability
-
-
-
-
-
Total Liabilities
354
417
499
575
703
APPLICATION OF FUNDS
Gross Block
279
284
314
354
394
Less: Acc. Depreciation
212
226
239
253
269
Net Block
67
59
75
101
125
Capital Work-in-Progress
1
0
3
3
3
Other non-current assets
-
25
29
29
29
Investments
0
68
71
71
71
Current Assets
515
452
590
705
884
Inventories
287
283
317
430
537
Sundry Debtors
149
121
177
226
282
Cash
8
11
24
(24)
(11)
Loans & Advances
45
7
4
5
6
Other Assets
25
31
69
69
69
Current liabilities
233
192
274
339
414
Net Current Assets
282
260
316
366
470
Deferred Tax Asset
4
5
5
5
5
Mis. Exp. not written off
-
-
-
-
-
Total Assets
354
417
499
575
703
November 19, 2018
10
Initiating Coverage
VIP Industries
Cashflow Statement
Y/E March (`cr)
FY2016
FY2017
FY2018
FY2019E FY2020E
Profit before tax
95
125
190
267
335
Depreciation
14
14
13
14
16
Change in Working Capital
(30)
24
(43)
(127)
(90)
Interest / Dividend (Net)
1
1
0
1
1
Direct taxes paid
(27)
(40)
(63)
(88)
(111)
Others
0
0
0
0
0
Cash Flow from Operations
53
123
97
66
151
(Inc.)/ Dec. in Fixed Assets
(9)
(10)
(15)
(40)
(40)
(Inc.)/ Dec. in Investments
0
(67)
(4)
0
0
Cash Flow from Investing
(8)
(77)
(19)
(40)
(40)
Issue of Equity
0
0
0
0
0
Inc./(Dec.) in loans
0
(14)
0
0
0
Dividend Paid (Incl. Tax)
(27)
(34)
(55)
(77)
(97)
Interest / Dividend (Net)
(1)
(1)
(0)
(1)
(1)
Cash Flow from Financing
(45)
(49)
(55)
(77)
(97)
Inc./(Dec.) in Cash
0
(3)
24
(51)
14
Opening Cash balances
5
5
3
27
(24)
Closing Cash balances
5
3
27
(24)
(11)
November 19, 2018
11
Initiating Coverage
VIP Industries
Key Ratios
Y/E March
FY2016
FY2017
FY2018
FY2019E
FY2020E
Valuation Ratio (x)
P/E (on FDEPS)
98.2
76.8
51.5
36.5
29.0
P/CEPS
81.0
66.2
46.8
33.8
27.1
P/BV
19.2
16.0
13.3
11.6
9.4
Dividend yield (%)
0.4
0.5
0.6
1.2
1.5
EV/Sales
5.4
5.2
4.6
3.6
2.9
EV/EBITDA
60.4
48.7
33.3
23.9
19.1
EV / Total Assets
18.5
15.5
12.9
11.3
9.2
Per Share Data (Rs)
EPS (Basic)
4.7
6.0
9.0
12.7
15.9
EPS (fully diluted)
4.7
6.0
9.0
12.7
15.9
Cash EPS
5.7
7.0
9.9
13.7
17.0
DPS
2.0
2.4
3.0
5.4
6.8
Book Value
24.0
28.9
34.6
40.0
49.0
Returns (%)
ROCE
26.6
29.1
36.9
45.4
46.6
Angel ROIC (Pre-tax)
27.2
36.0
45.8
49.6
51.0
ROE
19.6
20.9
25.9
31.7
32.4
Turnover ratios (x)
Asset Turnover (Gross Block)
4.4
4.4
4.5
5.1
5.7
Inventory / Sales (days)
86
87
87
87
87
Receivables (days)
45
35
46
46
46
Payables (days)
52
42
55
55
55
Working capital cycle (ex-cash)
79
80
78
78
78
(days)
Source: Company, Angel Research
November 19, 2018
12
Initiating Coverage
VIP Industries
Research Team Tel: 022 - 39357800
DISCLAIMER
Angel Broking Limited (hereinafter referred to as “Angel”) is a registered Member of National Stock Exchange of India Limited, Bombay
Stock Exchange Limited, Metropolitan Stock Exchange Limited, Multi Commodity Exchange of India Ltd and National Commodity &
Derivatives Exchange Ltd It is also registered as a Depository Participant with CDSL and Portfolio Manager and Investment Adviser with
SEBI. It also has registration with AMFI as a Mutual Fund Distributor. Angel Broking Limited is a registered entity with SEBI for Research
Analyst in terms of SEBI (Research Analyst) Regulations, 2014 vide registration number INH000000164. Angel or its associates has not
been debarred/ suspended by SEBI or any other regulatory authority for accessing /dealing in securities Market. Angel or its
associates/analyst has not received any compensation / managed or co-managed public offering of securities of the company covered
by Analyst during the past twelve months.
This document is solely for the personal information of the recipient, and must not be singularly used as the basis of any investment
decision. Nothing in this document should be construed as investment or financial advice. Each recipient of this document should make
such investigations as they deem necessary to arrive at an independent evaluation of an investment in the securities of the companies
referred to in this document (including the merits and risks involved), and should consult their own advisors to determine the merits and
risks of such an investment.
Reports based on technical and derivative analysis center on studying charts of a stock's price movement, outstanding positions and
trading volume, as opposed to focusing on a company's fundamentals and, as such, may not match with a report on a company's
fundamentals. Investors are advised to refer the Fundamental and Technical Research Reports available on our website to evaluate the
contrary view, if any
The information in this document has been printed on the basis of publicly available information, internal data and other reliable
sources believed to be true, but we do not represent that it is accurate or complete and it should not be relied on as such, as this
document is for general guidance only. Angel Broking Limited or any of its affiliates/ group companies shall not be in any way
responsible for any loss or damage that may arise to any person from any inadvertent error in the information contained in this report.
Angel Broking Limited has not independently verified all the information contained within this document. Accordingly, we cannot testify,
nor make any representation or warranty, express or implied, to the accuracy, contents or data contained within this document. While
Angel Broking Limited endeavors to update on a reasonable basis the information discussed in this material, there may be regulatory,
compliance, or other reasons that prevent us from doing so.
This document is being supplied to you solely for your information, and its contents, information or data may not be reproduced,
redistributed or passed on, directly or indirectly.
Neither Angel Broking Limited, nor its directors, employees or affiliates shall be liable for any loss or damage that may arise from or in
connection with the use of this information.
Disclosure of Interest Statement
VIP Industries
1. Analyst ownership of the stock
No
2. Angel and its Group companies ownership of the stock
No
3. Angel and its Group companies' Directors ownership of the stock
No
4. Broking relationship with company covered
No
Ratings (Based on expected returns
Buy (> 15%)
Accumulate (5% to 15%)
Neutral (-5 to 5%)
over 12 months investment period):
Reduce (-5% to -15%)
Sell (< -15)